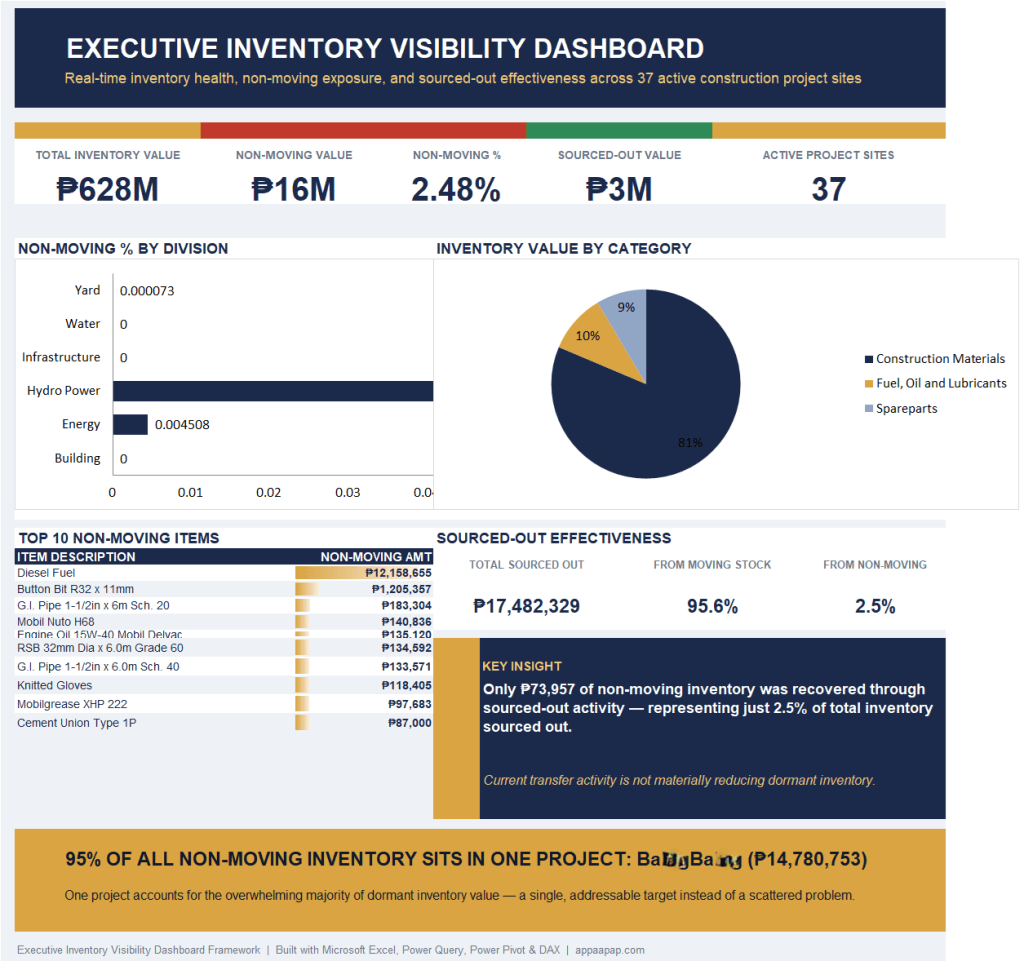
Turn 37 Separate Excel Reports Into One Executive Dashboard
Stop spending hours consolidating Excel reports every month.
LLearn the exact Microsoft Excel, Power Query, Power Pivot, and DAX framework used to automate executive inventory reporting across 37 active construction project sites.
Developed from years of practical implementation—not classroom theory—this framework demonstrates how to transform raw operational data into executive-ready dashboards that support faster, more informed business decisions.
Trusted by Professionals
⭐ 5.0/5 Verified Rating
📘 82-Page Step-by-Step eBook
🏗 Based on a Real Implementation Supporting 37 Active Project Sites
⚡ Nearly 10 Years of Practical Experience (Since 2016)
🔄 Reduce Reporting Time from Hours to Minutes
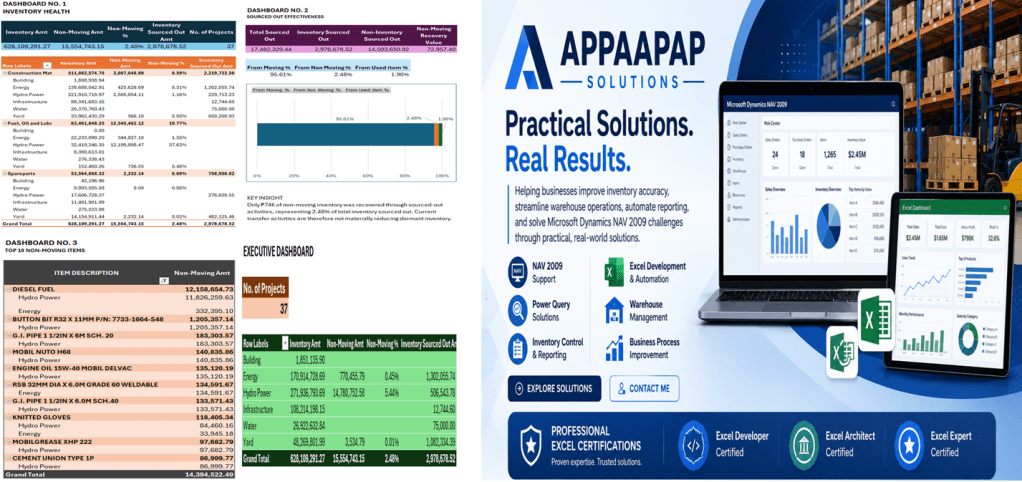
✔ Developed from a production reporting system used in large-scale construction operations.
Why I Created This Framework
Every month I faced the same challenge.
Inventory reports from dozens of project sites had to be consolidated into meaningful information for management.
The process was repetitive, time-consuming, and prone to manual errors.
Over the years, I developed a reporting framework using Microsoft Excel, Power Query, Power Pivot, and DAX that transformed this process into a streamlined, repeatable workflow.
This product is the result of that experience.
My goal is simple:
Help professionals spend less time preparing reports and more time making better business decisions.
Why This Framework Is Different
Unlike most Excel books that use fictional examples, this framework is based on an actual implementation supporting 37 active project sites.
It was developed to solve real operational challenges faced by warehouse, inventory, and ERP professionals.
What makes it different?
✔ Real business implementation—not classroom exercises.
✔ Built using actual operational data.
✔ Beginner-friendly with step-by-step explanations.
✔ Covers Power Query, Power Pivot, DAX, and Dashboard Development in one complete framework.
✔ Includes practice workbooks and cheat sheets.
✔ Created by a Microsoft Excel Expert and ERP Systems Administrator with practical industry experience.
Perfect for:
This framework is designed for professionals responsible for transforming operational data into meaningful management reports, including:
• Supply Chain Professionals
• Warehouse Managers
• Inventory Controllers
• Inventory Analysts
• Operations Managers
• Procurement Professionals
• ERP Users
• Business Analysts
• Data Analysts
• Microsoft Excel Users
• Microsoft Dynamics NAV Users
• Anyone looking to automate inventory reporting using Excel
What You’ll Achieve
By the end of this framework, you’ll be able to:
✔ Build a professional Executive Inventory Dashboard
✔ Automate the consolidation of multiple Excel workbooks using Power Query
✔ Create a clean Power Pivot Data Model
✔ Write practical DAX measures for inventory analytics
✔ Detect Non-Moving Inventory automatically
✔ Generate management-ready reports in minutes instead of hours
What You’ll Receive
📘 Executive Inventory Visibility Dashboard Framework (100 Pages)
📂 Practice Workbooks
📊 Dashboard Files
📋 Power Query M Formula Cheat Sheet
📈 DAX Formula Cheat Sheet
📖 Real Business Case Study
📄 Complete Documentation
Why This Framework Is Different
Unlike most Excel books that use fictional examples, this framework is based on an actual implementation supporting 37 active project sites. Every concept, workbook, dashboard, and report was developed from real operational requirements, making it practical, transferable, and immediately applicable to your own organization.
⭐ Trusted by Industry Professionals
⭐⭐⭐⭐⭐ “One of the Best Resources for Excel and Data Analysis”
“This eBook on Power Query and Power Pivot is exceptionally well organized, making complex concepts easy to understand through a clear, step-by-step learning approach. It significantly improves reporting efficiency while reducing manual work and overtime.”
— Ms. Glydee Formentera
System Analyst
Verified purchaser through Gumroad.
⭐⭐⭐⭐⭐
“A Practical Guide Written by a Real ERP Practitioner”
“This framework demonstrates how advanced reporting and executive dashboards can be built using Microsoft Excel, Power Query, Power Pivot, and DAX without requiring programming expertise. It offers practical solutions based on real-world operational challenges.”
– Chris Waga
Inventory Analyst
Verified purchaser through Gumroad.
⭐⭐⭐⭐⭐
“Reliable and Practical for Inventory Reporting”
“The dashboard simplifies inventory reporting by automating data preparation and presenting management information clearly. It saves time, improves reporting accuracy, and greatly reduces manual work.”
— Jenefer Laparan
Assistant Accounting Manager
⭐⭐⭐⭐⭐
“Refreshing Reports Takes Minutes”
“After the initial setup, refreshing inventory reports takes only a few minutes instead of hours of manual consolidation. This framework is highly recommended for warehouse and accounting reporting.”
— Rico Precioso
Assistant Warehouse Manager
“Easy-to-Follow Even for Beginners”
“The step-by-step explanations make complex formulas much easier to understand. It is an excellent learning resource for anyone wanting to improve their Excel reporting skills.”
— Meynard Gante
Inventory Control Head
Frequently Asked Questions
Do I need to know how to code?
No. This framework is designed for Microsoft Excel users—not software developers. If you’re comfortable using Excel formulas, tables, and PivotTables, you can follow the step-by-step guide.
Does this work on Mac?
This framework is designed for Microsoft Excel on Windows (Excel 2019, Excel 2021, or Microsoft 365). Some Power Pivot features are not fully supported on Mac.
What exactly will I receive?
You’ll receive:
- Complete eBook (PDF)
- Executive Dashboard Workbook
- Power Query Files
- Power Pivot Data Model
- DAX Calculations
- Practice Workbook
- Documentation
- Bonus Cheat Sheets
How long will it take to complete?
Most users can complete the framework over a weekend by following the guide step by step. If you’re adapting the templates to your own data, you can work at your own pace.
Can I use this with SAP, Oracle, or another ERP?
Yes.
Although this framework was developed using Microsoft Dynamics NAV, the Power Query and DAX techniques work with any ERP system that exports data to Excel or CSV.
What if I need help?
You can contact me directly if you experience any technical issues or have questions while using the framework.
Is there a refund policy?
Yes.
Your purchase is covered by a 30-Day Money-Back Guarantee for eligible issues related to accessing or downloading the product.
━━━━━━━━━━━━━━━━━━━━━━
LIMITED LAUNCH OFFER
Regular Price: US$24.99
Launch Price
US$17.99
✔ Lifetime Updates
✔ Instant Download
✔ Bonus Files Included
✔ Instant Download
✔ 30-Day Money-Back Guarantee
✔ Secure Checkout Powered by Gumroad
⭐⭐⭐⭐⭐ Rated 5.0/5 by Industry Professionals
“One of the best resources for Excel and Power Query.”
Special launch pricing is available to the first 50 customers only.
📩 Instant digital download after successful payment.
🔒 Secure Checkout
Digital download.
Lifetime access.
Future Version 1.x updates included.
━━━━━━━━━━━━━━━━━━━━━━
About the Author
Agapito Dalanon is an Assistant Warehouse Manager and ERP Systems Administrator with nearly a decade of practical experience developing Excel-based reporting solutions for large-scale construction operations.
Since 2016, he has continuously learned, applied, and refined Microsoft Excel, Power Query, Power Pivot, and DAX to automate reporting, improve inventory visibility, and support executive decision-making.
His work includes integrating Microsoft Dynamics NAV with Excel-based analytics to streamline reporting across 37 active construction project sites, reducing manual reporting effort while improving reporting accuracy and consistency.
This framework captures the practical methods, automation techniques, and reporting architecture developed through years of solving real operational reporting challenges.
Professional Expertise:
✔ Microsoft Excel Expert
✔ Power Query
✔ Power Pivot
✔ DAX
✔ Microsoft Dynamics NAV
✔ Warehouse Operations
✔ Supply Chain Reporting
✔ Executive Dashboard Development
🚀 Ready to Transform Your Inventory Reporting?
Stop spending hours manually preparing reports and start building executive dashboards that deliver meaningful business insights.
Learn the same Microsoft Excel, Power Query, Power Pivot, and DAX framework developed through nearly 10 years of practical experience and successfully implemented across 37 active construction project sites.
Whether you’re a Warehouse Manager, Inventory Controller, Supply Chain Professional, Business Analyst, or Microsoft Excel user, this framework will help you automate reporting, improve inventory visibility, and support better business decisions.
 APPAAPAP